A MORPHEUS PRODUCTION
THE ENVIRONMENTAL KUZNET'S CURVE
A STUDY OF PM2.5 DATA AND LEVEL OF DEVELOPMENT
Why is PM2.5 concentration (air pollution) a concern?
higher chance of lung cancer, stroke, heart disease
of deaths due to air pollution
people are exposed to dangerous levels of air pollution
Air Quality Database
Our Research


Abstract / Summary:

Our research attempts to evaluate the validity of the Environmental Kuznets curve, named after Nobel Prize-winning economist Simon Kuznets, which relates environmental degradation (pollution) to the stage of economic development. We use Particulate Matter (PM2.5) concentration data from the WHO’s API and various development indicators from the World Bank’s database to test for a relationship between development and pollution. Using yearly data from 175 countries, we find little evidence of the relationship implied by Kuznets. We also use micro-level data in Brazil to do a spatial analysis of the relationship between GDP/capita and PM2.5 in Brazilian cities. Once again, this approach generated a weak relationship between the levels of pollution and economic development.
We use Particulate Matter (PM2.5) concentration data from the WHO’s API and various development indicators from the World Bank’s database to test for a relationship between development and pollution. Using yearly data from 175 countries, we find little evidence of the relationship implied by Kuznets.
We also use micro-level data in Brazil , to do a spacial analysis of the relationship between GDP/capita and PM2.5 in Brazil city capitals. Once again, this approach generated a weak relationship between the levels of pollution and economic development.
Our initial aims and motivation
We started working on initial ideas around the time of the COP27, so we wanted to look into the theme of climate data. We were inspired by the works of UChicago’s Esteban Rossi-Hansberg on quantitative spatial economics, notably his works using satellite data to trace global warming. We initially wanted to focus on an economic region, such as Sub-Saharan Africa, and look at changes in development and air pollution over time. For example, comparing economies such as Nigeria and Mali and their levels of air pollution over time could tell us about the shape of the Kuznets curve during the industrialisation stage.
The Environmental Kuznets Curve theory (EKC), formally introduced by Grossman and Krueger (1991), suggests a U shaped relationship between environmental degradation and income, namely that the level of environmental degradation peaks at a given income level, after which environmental quality improves. Comparing these levels to average pollution levels (over the last two decades) in developed economies (namely Europe) would give a broad indication of the validity of this U shape. However, because of constraints on data (particularly in developing economies in Sub Saharan Africa), we opted to look at yearly pollution data with a larger sample of countries. Gathering pollution data by country for a given year would enable us to show all stages of development and obtain a worldwide EKC. It has been theorised that economic development can lead to improvements in environmental quality through different channels. For example, past the industrialisation stage, the size of the manufacturing sector in the economy goes down, and the share of services goes up. As such, polluting industries are offshored to industrialising economies, which have a cheaper workforce. This would suggest that as countries become more developed, environmental quality improves, whilst their pollution is offshored to industrialising economies. However, The Environmental Kuznets Curve has been tested empirically in a number of studies, but the results have been mixed. Hence, we wanted to further investigate it.
.jpg)
A goal of COP27 is to help industrializing economies navigate a lower emission path without sacrificing economic development. For pertinent policy proposals, it is important to have a good understanding of the relationship between economic development and environmental degradation. The Environmental Kuznets Curve can help expound this relationship.
Our central hypothesis is that PM2.5 concentration peaks at a certain level of economic developement after which they decrease. We are expecting to see an inverted U shape relationship between environmental degradation and economic development.
Our Main Aim:
The primary aim of our project is to test if our data displays the relationship implied by the Environmental Kuznets Curve. Our final curve will have a combined development index on the x-axis and PM2.5 concentration on the y-axis. Our data points will be individual countries’ level of development and level of air pollution for a given time period.
We will create a development index by using Principal Component Analysis (PCA) on an array of development indicators, using the first component as a proxy for level of development. We will show variation in development by using a large sample of countries at different stages of development. If our hypothesis is correct, we will expect the graph to have an inverted U shape.
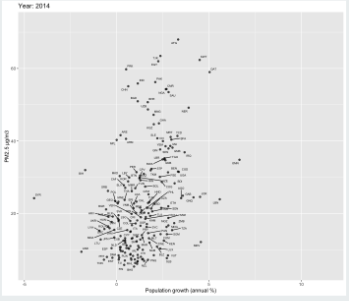
Secondly, we will use individual development indicators, such as GNI/capita, life expectancy and population to predict the level of air pollution. We will also test our relation by looking at variations within a country, using city-level pollution data for Brazil.